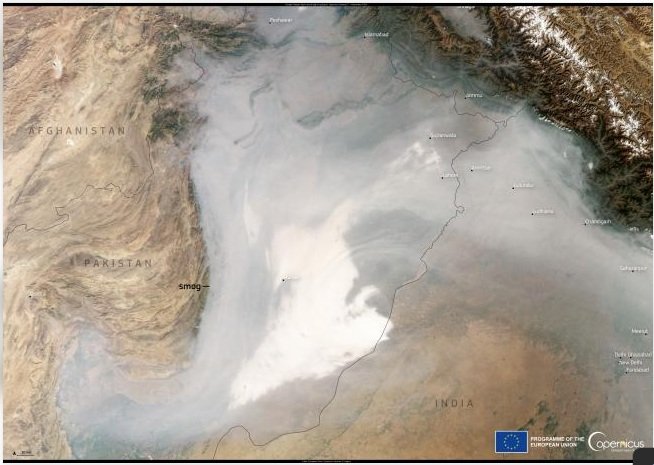
Lahore’s winter smog is often described as a seasonal emergency, but the pollution problem is not created by winter alone. The colder months expose a deeper structural problem: a large year-round emissions burden from homes, transport, industry, agriculture and waste is compressed into a shallow layer of air when winds weaken and temperature inversions limit vertical mixing. Regional smoke and dust can add to the load, but the evidence increasingly points away from a single-cause explanation and toward an airshed problem that requires action across sectors and jurisdictions.
That distinction matters. If smog is treated only as a crop-burning episode or a traffic problem, policy can miss the combination of sources that keeps fine-particle exposure high. For residents, it also explains why an apparently clear afternoon does not necessarily mean low exposure and why conditions can change rapidly from one neighborhood, hour or weather pattern to another.
Key takeaways
- Punjab’s PM2.5 burden comes from multiple sources. World Bank project analysis attributes 75% of Punjab air pollution to anthropogenic sources and 25% to natural sources.
- For Punjab, the cited sector shares of PM2.5 concentration include residential sources (23%), transport (16%), industry (16%), agriculture and livestock (13%) and municipal solid-waste burning (7%). In Greater Lahore, residential and transport shares are higher at about 28% and 24% respectively.
- Winter meteorology magnifies emissions: stable air, weak winds and inversions can trap pollution close to the surface.
- Punjab’s Clean Air Program, backed by a US$300 million World Bank IDA loan approved in 2025, aims to reduce PM2.5 levels by 35% over a decade and includes monitoring, transport, agriculture, fuel-quality and institutional measures.
- The most useful personal response is not to guess from visibility. Check current AQI/PM2.5, reduce strenuous outdoor exposure during severe episodes, and use effective indoor filtration where appropriate.
Lahore is an airshed problem, not a single-source story
Air pollution moves. A monitoring station records what arrives at that location, not only what was emitted beside it. Lahore sits within a densely populated and economically active region where emissions from households, roads, factories, brick kilns, farms and waste burning can interact with transported pollution and natural dust. The practical implication is that city boundaries are poor boundaries for air-quality management: actions inside Lahore can help, but they cannot fully solve episodes shaped by the wider Punjab and Indo-Gangetic airshed.
The World Bank’s Punjab Clean Air Program documentation is useful because it quantifies this multi-source picture. Across Punjab, residential combustion is estimated to contribute 23% of PM2.5 concentrations, transport 16%, industry 16%, agriculture and livestock 13%, and municipal solid-waste burning 7%. Natural sources account for 25%. For Greater Lahore, the residential share rises to 28% and transport to 24%, while natural sources fall to about 9%. These are modelling-based source-attribution estimates rather than a claim that every winter day has the same mixture, but they make one point clear: no credible solution can focus on only one sector.
Why winter turns pollution into smog
Winter does not manufacture emissions, but it changes the atmosphere’s ability to disperse them. On many cold nights the ground cools faster than the air above it. A warmer layer can then sit above cooler surface air, suppressing the normal upward mixing that would dilute pollution. Weak winds further reduce horizontal dispersion. A shallower mixing layer means the same emissions can produce much higher near-surface concentrations.
Humidity and fog complicate what people see and what some particle instruments measure. Hygroscopic particles can take up water, changing their size and optical properties. For reliable interpretation, distinguish measured or modelled pollutant concentration from the calculated AQI, and check observation time and data source. Visibility is useful as a warning sign, but it is not a substitute for PM2.5 measurement.
The major source groups
1. Homes and small-scale combustion
Residential fuel use can generate primary particles and gases that form secondary PM2.5. The importance of this source is sometimes overlooked because emissions are distributed across thousands of homes rather than concentrated in a single stack. Cleaner household energy can therefore produce both indoor and outdoor air-quality benefits.
2. Transport and road activity
Vehicles contribute through exhaust, but traffic pollution is broader than tailpipes. Heavy-duty diesel vehicles, two- and three-wheelers, congestion, poorly maintained engines, resuspended road dust and brake and tyre wear all matter. The Greater Lahore source estimate gives transport a larger share than the province-wide average, which supports treating cleaner mobility as a central urban intervention rather than a secondary measure.
3. Industry and brick kilns
Industrial fuel combustion and brick production can emit particulate matter, sulfur compounds, nitrogen oxides and other precursors. Effective controls depend on fuel quality, combustion efficiency, stack controls, inspection and enforcement. Modernizing a kiln or industrial process matters only if the cleaner operating standard is sustained in practice.
4. Agriculture and crop-residue burning
Seasonal burning can create sharp regional smoke pulses at exactly the time of year when dispersion is poor. Yet the source-apportionment evidence argues against portraying crop burning as the entire Lahore problem. Agricultural measures are most effective as part of a package that also addresses transport, industry, households and waste.
5. Waste burning and dust
Open waste burning is avoidable combustion occurring close to where people live. Dust is more complicated: coarse dust can raise PM10, while fine mineral particles also contribute to PM2.5. Construction management, paved-road maintenance, waste collection and enforcement can therefore complement combustion controls.
Health: why PM2.5 is the central concern
PM2.5 is small enough to penetrate deep into the respiratory system and is associated with cardiovascular and respiratory harm. WHO’s 2021 guideline recommends an annual PM2.5 concentration of 5 µg/m³ and a 24-hour level of 15 µg/m³ as health-based reference values. These are guidelines rather than Pakistan’s legal standards, but they provide a useful benchmark for understanding the scale of exposure.
Risk is not confined to days that look catastrophic. Long-term exposure matters, while short high-pollution episodes can be especially difficult for children, older adults, pregnant people and those with heart or lung disease. Public communication should therefore combine current AQI with longer-term context rather than treating each day as an isolated event.
What Punjab’s Clean Air Program changes
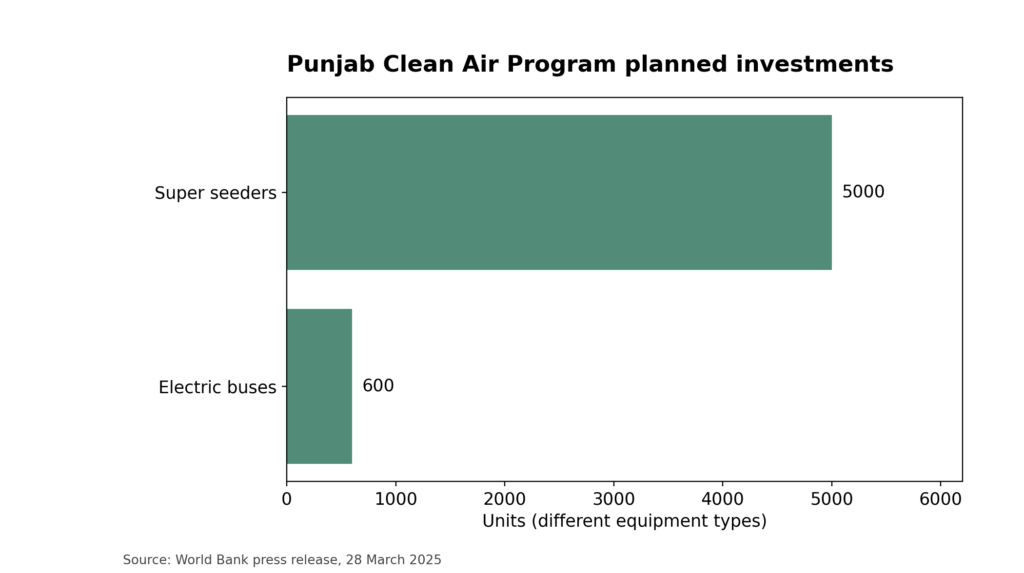
Figure: Punjab program targets and implementation indicators shown in the report chart.
In March 2025 the World Bank approved a US$300 million concessional IDA loan for the Punjab Clean Air Program. The program supports Punjab’s Smog Mitigation Action Plan and targets a 35% reduction in PM2.5 over the next decade, with particular benefits expected for the roughly 13 million residents of Lahore Division. Planned interventions include 5,000 super seeders to reduce crop-residue burning, 600 electric buses, expansion of regulatory-grade monitoring stations and two fuel-quality testing laboratories, alongside institutional strengthening and public engagement.
The program’s importance is not just the equipment count. Better monitoring and emissions inventories can make policy more accountable: authorities can identify whether concentrations are falling, which sectors remain dominant, and whether measures are working across multiple seasons. Evaluating policy outcomes requires multi-season evidence and careful attention to weather and other confounding factors; simple before-and-after comparisons do not establish causation.
What residents can do during severe episodes
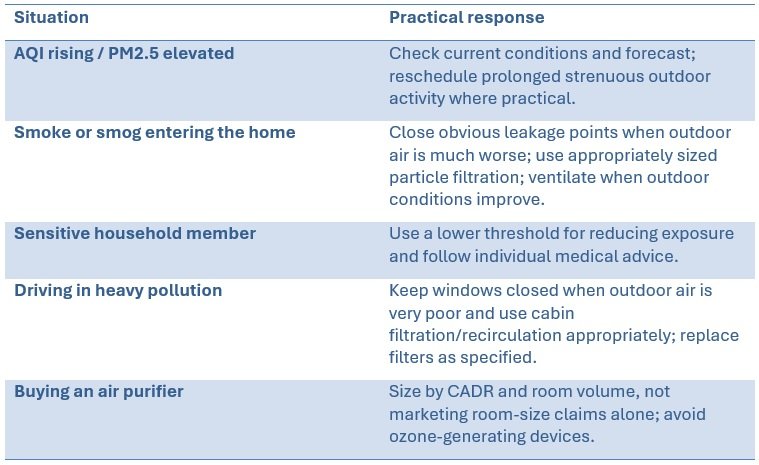
Figure: Table showing situation and practical solutions during severe Air Pollution
What to watch next
The most useful indicators are not a single headline AQI record. Watch whether Punjab expands regulatory monitoring, whether winter PM2.5 peaks and seasonal averages fall over several years, whether cleaner buses and fuel-quality enforcement change urban transport emissions, whether crop-residue management is sustained, and whether industrial and household combustion decline. Progress should be assessed across multiple stations and seasons because weather can make one winter appear better or worse even when emissions are changing.
Why visibility is a poor pollution meter
A photograph of a hazy skyline can help communicate a problem, but it cannot identify the pollutant mixture or tell residents how much fine particulate matter they are breathing. Water droplets, humidity, coarse dust and light conditions all influence visibility. Conversely, substantial PM2.5 exposure can occur on days that do not look exceptionally hazy. A defensible report should therefore distinguish observed PM2.5 concentrations from an AQI category, and distinguish both from visual impressions. When displaying a live Lahore AQI card, include the observation time, source and index convention; avoid describing a modelled value as if it were a directly measured station reading.
Airshed coordination is a practical necessity
A city-only response cannot fully address a pollutant that crosses district and national boundaries. Crop burning, traffic corridors, power and industrial emissions, residential combustion and atmospheric chemistry operate on different spatial and time scales. Local enforcement can reduce exposures near roads and facilities; provincial measures can improve fuels and agricultural practices; regional coordination can address transported smoke and precursor emissions. These interventions complement rather than replace one another. The sensible performance measure is a sustained reduction in population exposure, not simply fewer exceptionally bad photographs or fewer emergency closures.
How to judge whether policy is working
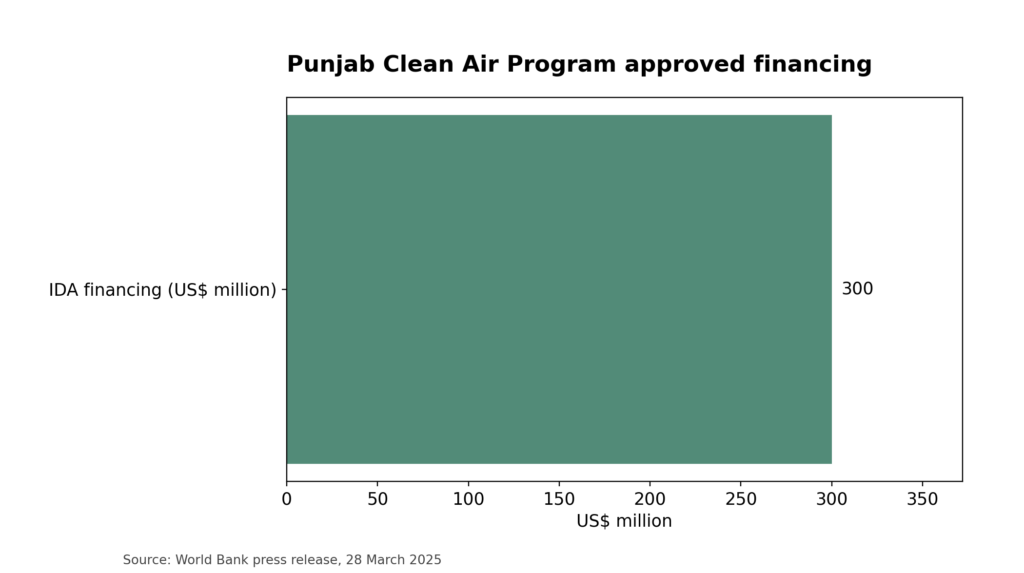
Figure: Chart showing the documented Punjab clean-air program financing components.
Track several indicators together: quality-assured annual and seasonal PM2.5 concentrations; the frequency and duration of severe episodes; the geographic reach of monitoring; enforcement and adoption of cleaner technology; and the distribution of benefits across neighborhoods. A lower winter peak is welcome, but a credible evaluation also asks whether average exposure is declining over years. Weather-normalized comparisons can help avoid attributing a windy winter to policy success. The World Bank’s 35% target is a program ambition, not a result already achieved, and should always be labelled accordingly.
A reader checklist for high-pollution days
Start with the nearest trustworthy observation and check its timestamp. If outdoor particle pollution is elevated, consider postponing vigorous outdoor exercise, reducing the entry of outdoor smoke into an indoor refuge, and using a properly sized particle-filtering air cleaner where feasible. A well-fitting certified particulate respirator can reduce particle inhalation during unavoidable exposure, but does not remove gaseous pollutants and cannot substitute for clean-air policies. Children, older adults and people with respiratory or cardiovascular conditions may need more cautious activity decisions and should follow relevant medical advice. These steps reduce exposure; they do not eliminate risk.
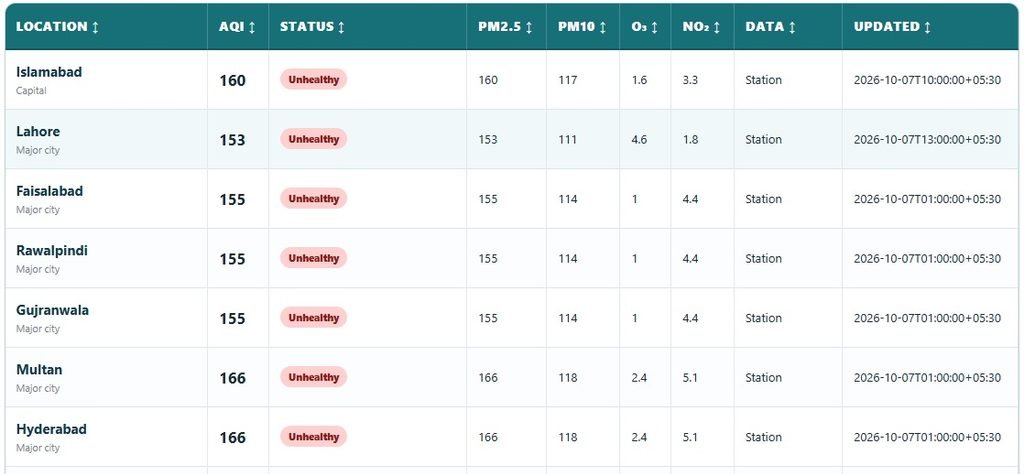
Figure: Data from AirQualityIndex.org, Air Quality in Pakistan https://airqualityindex.org/air-quality/pakistan/
Conclusion
Lahore’s smog is severe because a large emissions burden meets unfavorable winter meteorology. The evidence supports a multi-sector response: cleaner household energy, transport, industry, agriculture and waste management, backed by credible monitoring and regional coordination. For residents, the immediate task is exposure management based on current PM2.5/AQI; for policymakers, the harder task is reducing the emissions that make each winter meteorological trap so consequential. The new Punjab clean-air investment creates a measurable opportunity. The test will be whether sustained implementation produces lower exposure over years, not merely fewer alarming headlines on individual days.
Explore more
Air Quality Near Me, Air Quality in Pakistan, Lahore Air Quality, Karachi Air Quality
References and further reading
- World Bank. Pakistan: World Bank Supports Punjab’s Smog Mitigation Action Plan with $300 Million Concessional Loan. 28 March 2025.
- World Bank. Punjab Clean Air Program project documentation (P508222), including source-apportionment estimates for Punjab and Greater Lahore.
- World Health Organization. WHO Global Air Quality Guidelines: PM2.5, PM10, ozone, NO2, SO2 and CO. 2021.
- World Bank. A Breath of Change: Solutions for Cleaner Air in the Indo-Gangetic Plains and Himalayan Foothills. 2025
