Review descriptive statistics
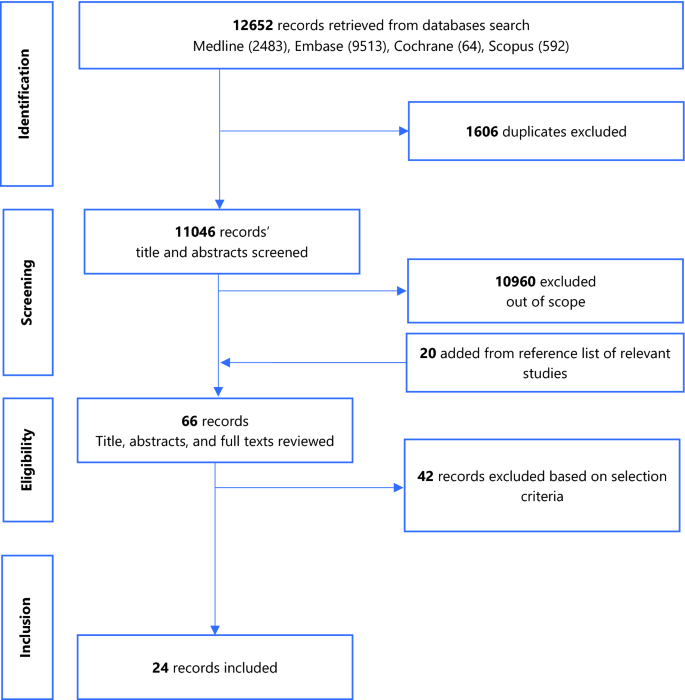
Figure 1 summarises the study selection process.

A total of 12,652 records were returned by the search. Following removal of duplicates, screening of titles and abstracts, addition of studies from the reference list of relevant studies, full-text reviews, 24 eligible studies were retained. Figure 1 summarises the PRISMA flow chart of the study selection process. The studies excluded following full-text review and the reasons for exclusion are presented in Additional file 4.
Narrative synthesis including study validity assessment
Most studies were from Asian countries and a total of 437,255 tuberculosis cases were reported across the 22 studies that reported the number of tuberculosis cases over their study periods (1996–2019)7,27,28,29,30,31,32,33,34,35,36,37,38,39,40,41,42,43,44,45,46. Of the 24 studies included in the review, 10 were time series, 5 were cohort studies (3 retrospective, 2 prospective), 5 were ecologic, 2 were case–control studies (1 nested, 1 retrospective), 1 was a retrospective case cross-over and 1 was cross-sectional. Average male participation was at 64.9% (N = 13 studies)7,27,29,30,31,32,33,34,35,37,40,43,46, mean age of 46.3 years (N = 7 studies)27,30,31,32,37,40,43 and average annual tuberculosis incidence was 45.3 per 100,000 population (N = 10 studies)7,27,29,32,35,36,45,46,47,48. Study and participant characteristics are summarised on Table 1.
The average of the annual mean concentrations of the various air pollutants are presented on Table 2.
Twelve studies were of good quality, eleven of fair quality and one of poor quality (Additional file 6). The overall quality of evidence for the association of all 6 air pollutants to the incidence of PTB was graded as low based on the study limitations affecting generalisability of the findings, and some inconsistency across the studies due to the significantly elevated between-study heterogeneity (Additional file 7).
Data synthesis
Association between air pollutants and pulmonary tuberculosis Incidence
PM2.5
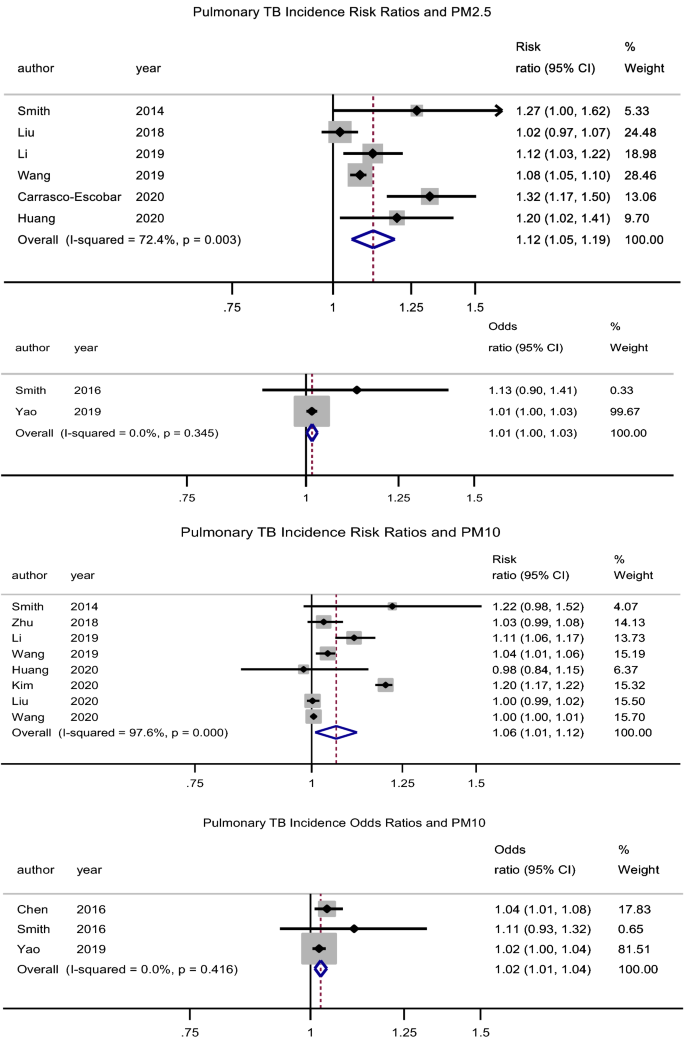
There was a significant association between exposure to PM2.5 and incidence of pulmonary tuberculosis (PTB), pooled adjusted RR = 1.12 (95% CI: 1.06–1.19), p < 0.001, N = 6, I2 = 72.4%7,29,38,39,43,49. There was no evidence of publication bias (Begg’s test, p = 0.133 and Egger’s test, p = 0.203). Begg’s test, p = 1. Likewise, Xiong et al.46 reported an association (RR = 3.10, 95% CI: 1.10–8.79) for a 50 µg/m3 increase in PM2.5 concentration. The study by Lai et al.32 (RR = 1.39, 95% CI: 0.95–2.03) which was cohort in design did not find a significant association. Jassal et al.28 reported an odds ratio of 25.3 (95% CI: 3.38–29.1).
PM10
There was a significant association between exposure to PM10 and incidence of PTB, pooled adjusted RR = 1.06 (95% CI: 1.01–1.12), p = 0.022, N = 8, I2 = 97.6% (Begg’s test, p = 0.536 and Egger’s test, p = 0.204)7,29,35,39,40,43,44,49. The studies by Lai et al.32 (HR = 0.95, 95% CI: 0.78–1.17) and Hwang et al.27 (male RR = 1.00, 95% CI: 0.96–1.05 and female RR = 1.01, 95% CI: 0.98–1.05) did not find a significant association. Likewise, the pooled adjusted OR was 1.03 (95% CI: 1.01–1.04), p = 0.001, N = 3, I2 = 0% (Begg’s test, p = 1 and Egger’s test, p = 0.211) (Fig. 2)31,34,37.

Forest plot showing the individual and pooled risk ratios and odds ratios for pulmonary tuberculosis incidence for PM2.5 and PM10. The dashed line on the Forest plot represents the overall pooled estimate. The grey squares and horizontal lines represent the vaccine acceptance rate of each study and their 95% confidence intervals. The size of the grey square represents the weight contributed by each study in the meta-analysis. The diamond represents the pooled vaccine acceptance rate and its 95% confidence intervals.
CO
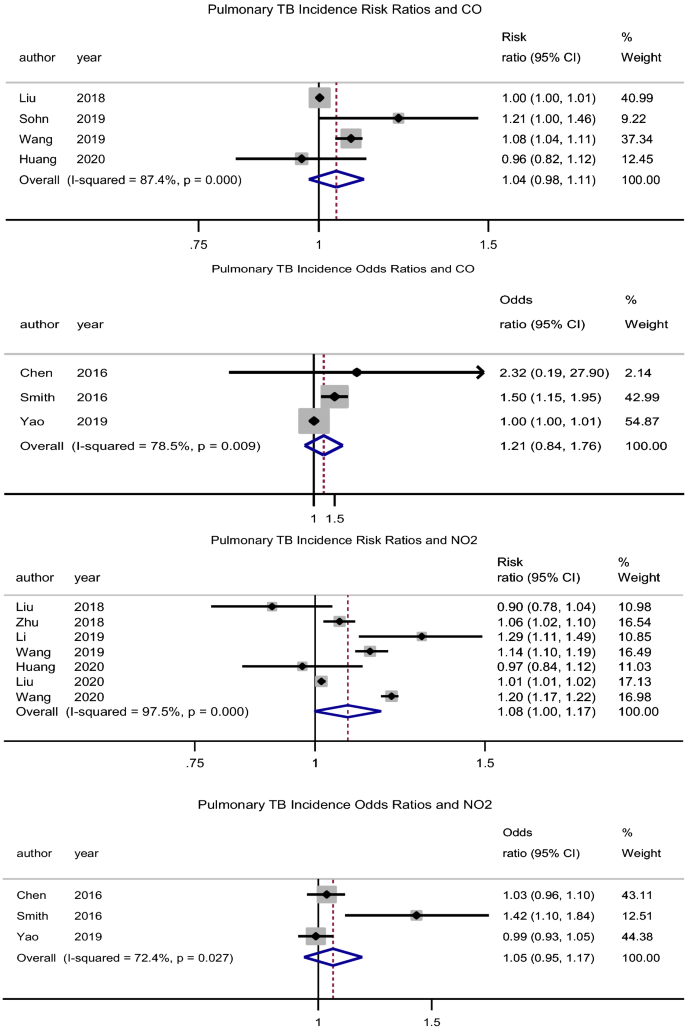
There was no significant association between exposure to CO and the incidence of PTB, pooled adjusted RR = 1.04 (95% CI: 0.98–1.11), p = 0.211, N = 4, I2 = 87.4% (Begg’s test, p = 0.734 and Egger’s test, p = 0.355)39,43,47,49. The studies by Lai et al.32 (HR = 1.89, 95% CI: 0.78–4.58) and Hwang et al.27 (male RR = 0.99, 95% CI: 0.95–1.03 and female RR = 1.01, 95% CI: 0.98–1.04) had similar findings. The pooled adjusted OR was 1.22 (95% CI: 0.84–1.76), p = 0.305, N = 3, I2 = 78.5% (Begg’s test, p = 1 and Egger’s test, p = 0.364) (Fig. 3)31,34,37. However, Xiong et al.46 (RR = 1.436, 95% CI: 1.004–2.053) reported a significant association for a 100 µg/m3 increase in CO concentration.

Forest plot showing the individual and pooled risk ratios and odds ratios for pulmonary tuberculosis incidence for CO and NO2. The dashed line on the Forest plot represents the overall pooled estimate. The grey squares and horizontal lines represent the odds ratios of each study and their 95% confidence intervals. The size of the grey square represents the weight contributed by each study in the meta-analysis. The diamond represents the pooled odds ratio and its 95% confidence intervals.
NO2
There was no association between exposure to NO2 and the incidence of PTB, pooled adjusted RR = 1.08 (95% CI: 0.99–1.17), p = 0.057, N = 7, I2 = 98% (Begg’s test, p = 1 and Egger’s test, p = 0.437) (Fig. 3)7,35,39,40,43,48,49. Lai et al.32 (HR = 1.33, 95% CI: 1.04–1.70) found a significant association, while Hwang et al.27 (male RR = 1.00, 95% CI: 0.96–1.05 and female RR = 1.01, 95% CI: 0.98–1.05) did not. Likewise, the pooled adjusted OR was 1.05 (95% CI: 0.95–1.17), p = 0.322, N = 3, I2 = 72.4% (Begg’s test, p = 0.296 and Egger’s test, p = 0.145) (Fig. 3)31,34,37. However, Xiong et al.46 (RR = 1.8, 95% CI: 1.11–2.91) reported a significant association for a 5 µg/m3 increase in NO2 concentration.
SO2
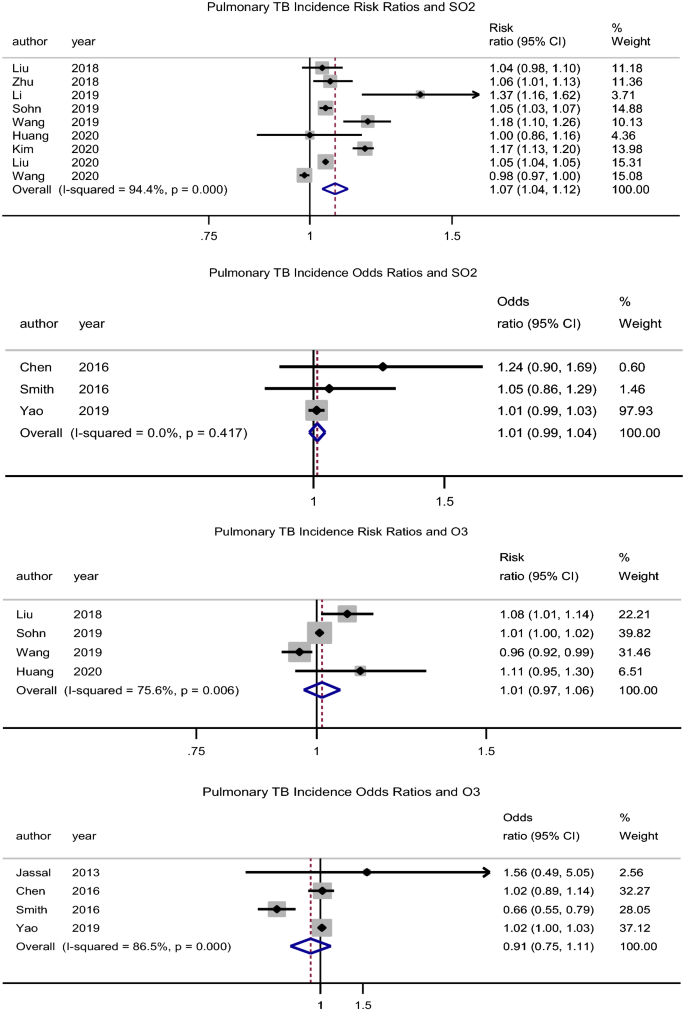
There was an association between exposure to SO2 and incidence of PTB, pooled adjusted RR = 1.08 (95% CI: 1.04–1.12), p < 0.001, N = 9, I2 = 94.4% (Begg’s test, p = 0.517 and Egger’s test, p = 0.356) (Fig. 4)7,35,39,40,43,44,47,48,49. Hwang et al.27 (male RR = 1.07, 95% CI: 1.03–1.12 and female RR = 1.02, 95% CI: 0.98–1.07) reported similar findings in males. Likewise, Xiong et al.46 reported an association (RR = 1.62, 95% CI: 1.12–2.33) for a 5 µg/m3 increase in SO2 concentration.

Forest plot showing the individual and pooled risk ratios and odds ratios for pulmonary tuberculosis incidence for SO2 and O3. The dashed line on the Forest plot represents the overall pooled estimate. The grey squares and horizontal lines represent the odds ratios of each study and their 95% confidence intervals. The size of the grey square represents the weight contributed by each study in the meta-analysis. The diamond represents the pooled odds ratio and its 95% confidence intervals.
O3
There was no significant association between O3 exposure and incidence of PTB, pooled adjusted RR = 1.01 (95% CI: 0.97–1.06), p = 0.560, N = 4, I2 = 75.6% (Begg’s test, p = 0.734 and Egger’s test, p = 0.734) (Fig. 4)39,43,47,49. While Hwang et al.27 had similar findings (male RR = 0.99, 95% CI: 0.94–1.03 and female RR = 1.01, 95% CI: 0.97–1.05), Lai et al.32 rather found a protective effect (HR = 0.69, 95% CI: 0.49–0.98). Xiong et al.46 reported an association (RR = 0.96, 95% CI: 0.93–1.0) for a 5 µg/m3 increase in O3 concentration.
Table 3 summarises the percentage change in the number of PTB cases for the respective changes in air pollutant concentrations.
Association between air pollutants and hospital admissions and mortality due to pulmonary tuberculosis
Two studies reported a significant association between PM2.5 and PTB mortality; OR = 1.46 (95% CI: 1.15–1.85)33 and percentage change in cases of 0.08% (95% CI: 0.06–0.09)45. There was no significant association between CO, SO2, and O3 and PTB mortality47 (Table 4). Likewise, there was no significant association between PM10, CO, SO2, O3 and hospital admission30,47. NO2 was associated with hospital admission due to PTB, OR: 1.21 (95% CI: 1.10–1.33) (Table 4).
Subgroup analysis and meta-regression
Studies were categorised according to their duration (less than 5 years and 5 years or more), location (Asia and others), number of PTB cases (less than 5000 and 5000 or more) and study quality (good and fair/poor). None of these study characteristics could explain the observed heterogeneity across studies, except for study location with regards to exposure to PM2.5 air pollutant. There was a higher risk of PTB incidence with PM2.5 exposure in studies conducted out of Asia (Additional file 5).

